Premarket scanner: find gappers and premarket gainers before the open
A premarket scanner lists the gappers and premarket gainers: stocks trading well above or below their previous close before the regular session opens. Bufflo’s Gappers table streams those moves live with gap, pre-market change, float and volume. For your own gap criteria, describe them in plain English and Bufflo AI builds the screen.
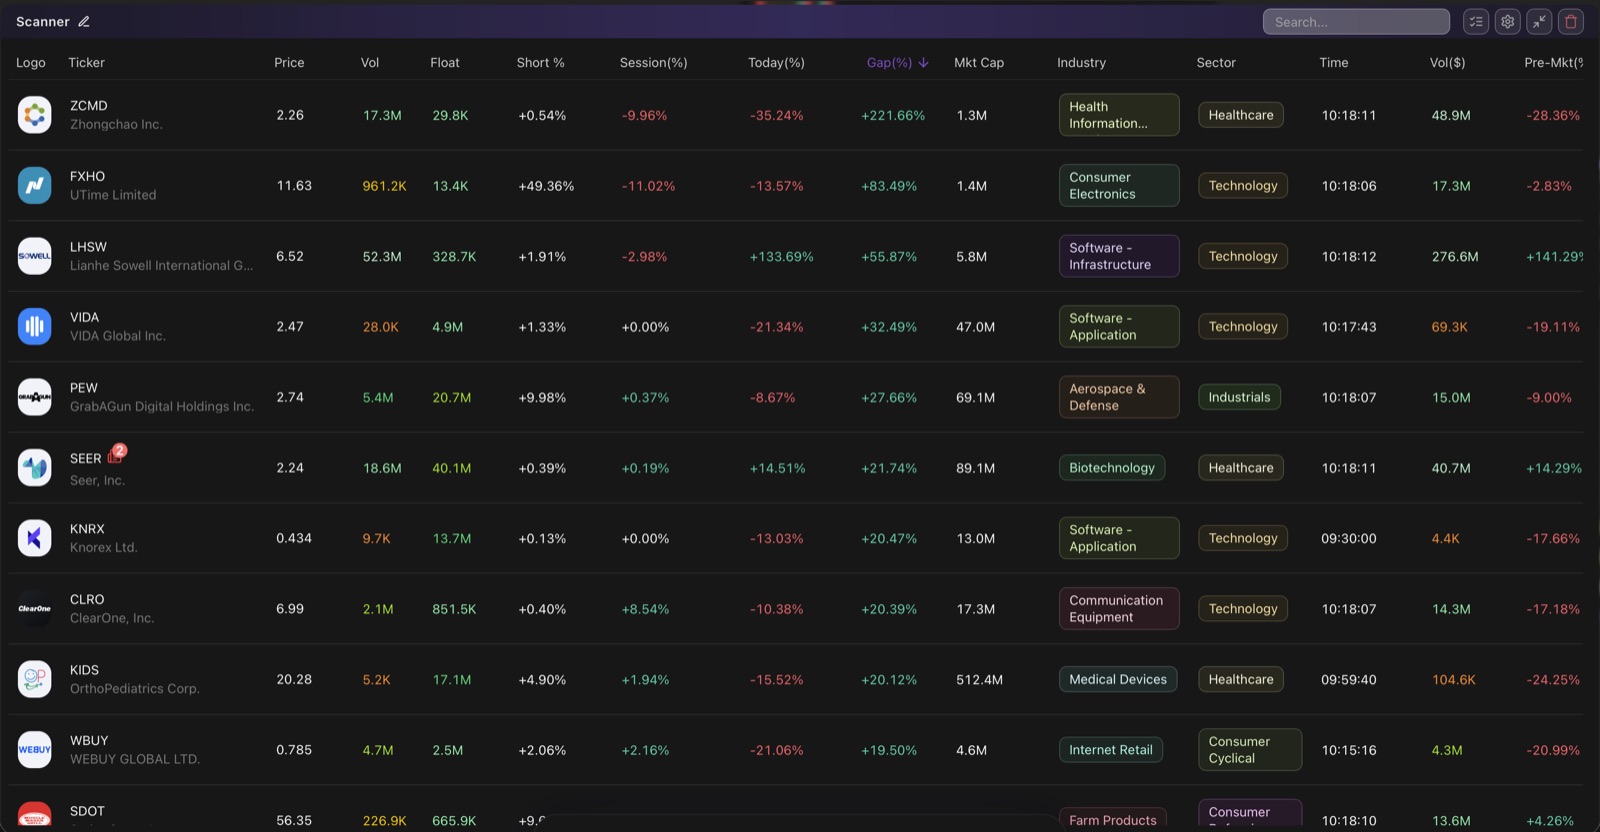
For many day traders the session starts long before 9:30. Earnings, news and overnight moves leave some stocks trading far from where they closed, and those gappers often become the most active names of the morning. The job before the open is to find them, understand why they are moving, and decide which are worth watching.
Try it: ask Bufflo AI
- Ask Bufflo AI“Gapping up over 4% premarket with a news catalyst and heavy volume”
- Ask Bufflo AI“Gapping up more than 10% premarket, under $20, with float below 20 million”
- Ask Bufflo AI“Gapping down more than 5% premarket on news, with at least 100k shares traded”
What is a premarket gap?
A gap is the difference between a stock’s previous close and where it is trading now, before the regular session has opened. It is usually expressed as a percentage:
“Gap % = (current pre-market price − previous close) ÷ previous close × 100”
A stock that closed at $5.00 and trades at $6.00 pre-market is gapping up 20%. A gap down is the same move in the other direction.
US pre-market trading starts as early as 4:00 a.m. ET on some venues; NYSE Arca’s early session, for example, runs from 4:00 to 9:30 a.m. ET. The regular session opens at 9:30 a.m. ET. Pre-market volume is thinner than regular-hours volume, so spreads can be wider and prices can move further on fewer shares.
What traders filter gappers on
A raw list of gappers is long and noisy. Most traders narrow it with the same handful of filters:
| Filter | What it tells you |
|---|---|
| Gap size | How far the stock has moved from its close. Many traders start at 4% or more. |
| Pre-market volume | Whether anyone is actually trading the move, or it is a few thin prints. |
| Float | How much supply there is. Low-float gappers can move fast in both directions. |
| Price range | Keeps the list to stocks you can and want to trade. |
| Catalyst | Earnings, news or a filing that explains the gap. |
These are starting points, not rules. Test any threshold against how your own setups have behaved.
Two ways to scan gappers in Bufflo
The Gappers table
Add a Gappers table to your workspace for a live, ready-made list of gapping stocks. Each row shows price, volume, dollar volume, float, gap, pre-market change, today’s change, market cap, short interest, sector and industry, and you can sort by any column. Turn on sound alerts to hear when a new name appears.
Your own gap screener
When you want specific criteria, describe them to Bufflo AI, for example “gapping up over 4% premarket with a news catalyst and heavy volume”. It builds an editable screener that you can run in a Scanner table, track in a Signal table and attach alerts to. See how the AI stock screener works.
How to find the top premarket gainers
- Sort the Gappers table by pre-market change to see the biggest premarket gainers first, or by gap to see the biggest moves from the close.
- Drop the thin ones. Pre-market volume shows whether a gainer is being traded or moved on a few small prints.
- Check the catalyst. A News table filtered to the same stocks shows the earnings, filing or headline behind each move.
- Mark the levels. Load each candidate on a linked chart and note the pre-market high and low before the open.
Gap up stocks with a catalyst, real pre-market volume and a float you are comfortable with usually make the shortest, most useful list.
A premarket routine in one workspace
- Gappers table to see everything moving from its close.
- A custom gap screener for the setups you actually trade.
- A News table filtered to the same screen, to check the catalyst behind each gap.
- A chart linked to the tables, so clicking a gapper loads its chart.
- An earnings calendar for the names reporting before the open.
When the bell rings, the same workspace keeps running. Your gap screen becomes a momentum scanner, and custom alerts can watch the names you shortlisted.
What happens to gaps after the open
A gap is information, not a direction. Some gappers keep moving in the direction of the gap after the open; others fade back toward the previous close as the pre-market move unwinds. Volume, the catalyst and how price behaves around the pre-market high or low are what traders watch to tell the two apart. Bufflo shows you the data; how to trade it is your call.
Frequently asked questions
What time does premarket trading start?
US pre-market trading starts as early as 4:00 a.m. ET on some venues and runs until the regular session opens at 9:30 a.m. ET. Bufflo streams data through pre-market, regular hours and after-hours.
What are premarket gainers?
Premarket gainers are the stocks up the most before the 9:30 a.m. ET open, measured from the previous close. Bufflo’s Gappers table lists them live with pre-market change, gap, float and volume.
How do you find gap up stocks?
Use a premarket scanner. Bufflo’s Gappers table lists gap up stocks live, or describe your criteria, such as “gapping up over 4% premarket with news and heavy volume”, and Bufflo AI builds the scan.
What is a good gap percentage to scan for?
There is no single number. Many day traders start with gaps of 4% or more and add volume, float and catalyst filters to keep the list short. Adjust the threshold to the stocks and setups you trade.
Does the scanner show after-hours moves too?
Yes. Bufflo covers after-hours as well as pre-market, and the scanner tables include an after-hours change column alongside gap and pre-market change.
Is a stock that gaps up a buy signal?
No. A gap shows that price has moved, not where it will go next. Bufflo provides market data and tools, not financial advice.
Try it on a live workspace.
Open Bufflo in your browser, describe what you want in plain English, and adjust everything yourself. No install, no code.
Sources
Market monitoring and analysis, not a brokerage. Not investment advice. Backtested results do not guarantee future performance. Data availability and refresh rates depend on your plan and market data providers.
All features